All told automakers sold 925,824 new cars and trucks in May, still weak, but the highest level in 2009.
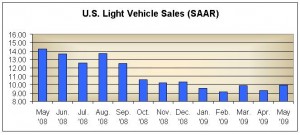
May vehicles sales of domestic and offshore-owned brands were down significantly, -30% from a year before when the seasonally adjusted annual sales rate (SAAR) was running at more than 14.2 million units.
This May the annual sales rate was a modest 9.91 million units, marking the fifth straight month the SAAR was below 10 million, according to the latest information from AutoData Corporation. Overall year-to-date light vehicle sales are off a staggering 37%.
May Maybe Bottom?
Perennially optimistic, or deluded, marketing execs took some small comfort by pointing out a sales increase of 106,284 units this May compared to April 2009, although this is still a silent spring when compared to the traditional spring bump up in sales.
All told automakers sold 925,824 new cars and trucks in May, the highest level in 2009.
Still, the U.S. auto industry remains mired in the toxic effects of the collapsed economy as the Great Recession rolls on.

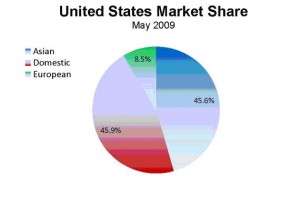
Domestic brands finished with 46% market share, as a majority of Americans continue to use their "buying votes " to shop elsewhere.
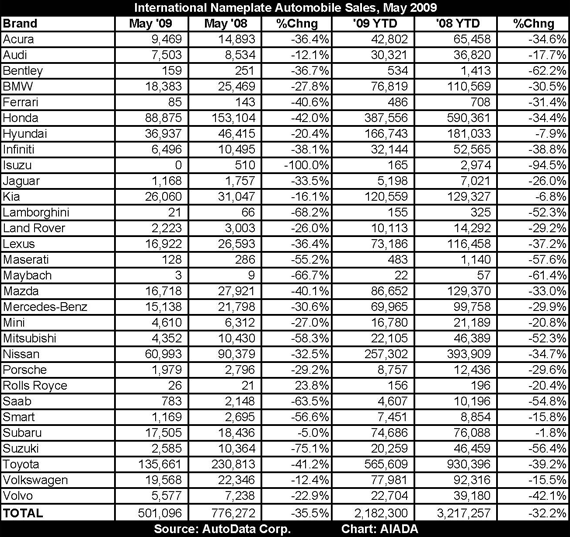
May sales saw no significant shifts in market share between domestic and offshore-owned brands. Offshore brands sold 501,096 vehicles in May, up from 442,124 vehicles in April, but down from 776,272 in May 2008, according to the American International Automobile Dealers Association.
Asian brands accounted for 45.6% of the market, down significantly from 48.1% in April 2008, but roughly consistent with 2009 share. European brands had an 8.5% share, up from 7.5% a year earlier, but again consistent with ’09 rates. Domestic brands finished the month with 46% of the market, as a majority of Americans used their buying vote to go elsewhere.
Bankruptcy Boredom?
It is hard to see any strong influences in buying patterns as a result of the Chrysler LLC bankruptcy and the widely-publicized impending General Motors Corporation bankruptcy during May. Chrysler sales were off 48% but the company sold more vehicles in May than April. Chrysler finished the month with 260,407 units in inventory, representing an 86-day supply. As a result of shutting all of its plants down, inventory is down 37% compared with May 2008 when it totaled 412,009 units.
“May was a very encouraging retail month for Chrysler and the industry,” said Steven Landry, Executive Vice President North American Sales and Marketing, Service and Parts – Chrysler LLC. “Retail sales for the industry came in stronger than expected and our retail performance during our restructuring was even stronger than the industry, giving us improved share and optimism that the market is showing signs of life.”
GM sales were off 29%. Ford, which continues to try and separate itself from those failed companies, saw sales decline 24%, a relative victory.
Year-to-date Ford, down 37%, is tracking the overall market, but you can understand why its Volvo subsidiary is for sale, it’s off 42%. While Chrysler at -46%, and GM at -42% are, well, underachieving except in loss making. Offshore brands are struggling and losing lots of money too: Toyota is off -39%, Nissan -35%, and Honda, -34%.
Small Car Road to Hell?
For fans of efficient cars and environmentalists who think the road to salvation for makers is paved with small cars, please note small vehicle specialist Suzuki – it’s off 56% year-to-date. And take a look at the two vehicles that are once again leading the Top Ten list below.
Top Ten Shifts
There were noticeable shifts in the Top Ten selling vehicles compared to April. Ford’s F-Series pickup truck took back its number one spot from the Honda Accord in May. The F-Series was the sales leader for every other month in 2009, except April. Following closely behind was the Chevrolet Silverado at number two; and both Toyota Camry and Corolla followed Silverado’s coattails, knocking Accord and Civic back to fifth and Sixth. The Dodge Ram pick-up truck , with sales of 15,516, dropped off the Top Ten list, allowing the Nissan Altima and Ford Escape to make it in.

American pickup trucks are back leading the list of most popular vehicles.
|
U.S. Light Vehicle Retail Sales – May 2009 |
||||||
|
May 2009 |
May 2008 |
% Chng |
2009 CYTD |
2008 CYTD |
% Chng. |
|
| General Motors Corp. | 190,881 | 268,892 | -29.0% | 772,733 | 1,326,906 |
-41.8% |
| Total Cars . | 81,009 | 130,115 | -37.7% | 319,417 | 580,280 |
-45.0% |
| Total Light Trucks | 109,872 | 138,777 | -20.8% | 453,316 | 746,626 |
-39.3% |
| memo: Saab | 783 | 2,148 | -63.5% | 4,607 | 10,196 |
-54.8% |
| Ford Motor Company | 161,197 | 212,508 | -24.1% | 618,369 | 977,746 |
-36.8% |
| Total Cars . | 67,197 | 89,877 | -25.2% | 240,364 | 359,850 |
-33.2% |
| Total Light Trucks | 94,000 | 122,631 | -23.3% | 378,005 | 617,896 |
-38.8% |
| memo: Volvo. | 5,577 | 7,238 | -22.9% | 22,704 | 39,180 |
-42.1% |
| Chrysler LLC | 79,010 | 148,747 | -46.9% | 402,900 | 750,369 |
-46.3% |
| Total Cars | 18,038 | 41,678 | -56.7% | 91,723 | 220,339 |
-58.4% |
| Total Light Truck | 60,972 | 107,069 | -43.1% | 311,177 | 530,030 |
-41.3% |
|
|
||||||
| Toyota Motor Sales | 152,583 | 257,406 | -40.7% | 638,795 | 1,046,854 |
-39.0% |
| Total Cars | 96,650 | 168,942 | -42.8% | 387,317 | 630,095 |
-38.5% |
| Total Light Trucks | 55,933 | 88,464 | -36.8% | 251,478 | 416,759 |
-39.7% |
| American Honda Motor | 98,344 | 167,997 | -41.5% | 430,358 | 655,819 |
-34.4% |
| Total Cars | 57,957 | 114,796 | -49.5% | 262,257 | 398,720 |
-34.2% |
| Total Light Trucks | 40,387 | 53,201 | -24.1% | 168,101 | 257,099 |
-34.6% |
| Nissan North America. | 67,489 | 100,874 | -33.1% | 289,446 | 446,474 |
-35.2% |
| Total Cars | 42,831 | 71,097 | -39.8% | 184,820 | 281,323 |
-34.3% |
| Total Light Trucks | 24,658 | 29,777 | -17.2% | 104,626 | 165,151 |
-36.6% |
| VW Group America | 27,251 | 31,197 | -12.6% | 108,991 | 130,874 |
-16.7% |
| Audi | 7,503 | 8,534 | -12.1% | 30,321 | 36,820 |
-17.7% |
| Volkswagen | 19,568 | 22,346 | -12.4% | 77,981 | 92,316 |
-15.5% |
| Bentley | 159 | 251 | -36.7% | 534 | 1,413 |
-62.2% |
| Lamborghini | 21 | 66 | -68.2% | 155 | 325 |
-52.3% |
| Mitsubishi Motors N. A. | 4,352 | 10,430 | -58.3% | 22,105 | 46,389 |
-52.3% |
| Total Cars | 3,130 | 8,416 | -62.8% | 15,616 | 36,107 |
-56.8% |
| Total Light Trucks | 1,222 | 2,014 | -39.3% | 6,489 | 10,282 |
-36.9% |
| Mazda Motor of America | 16,718 | 27,921 | -40.1% | 86,652 | 129,370 |
-33.0% |
| Total Cars | 11,331 | 19,414 | -41.6% | 59,408 | 86,140 |
-31.0% |
| Total Light Trucks | 5,387 | 8,507 | -36.7% | 27,244 | 43,230 |
-37.0% |
| Hyundai Motor America | 36,937 | 46,415 | -20.4% | 166,743 | 181,033 |
-7.9% |
| Total Cars | 27,933 | 36,450 | -23.4% | 124,372 | 131,504 |
-5.4% |
| Total Light Trucks | 9,004 | 9,965 | -9.6% | 42,371 | 49,529 |
-14.5% |
| BMW of North America | 23,019 | 31,802 | -27.6% | 93,755 | 131,954 |
-28.9% |
| BMW | 18,383 | 25,469 | -27.8% | 76,819 | 110,569 |
-30.5% |
| Mini | 4,610 | 6,312 | -27.0% | 16,780 | 21,189 |
-20.8% |
| Rolls Royce | 26 | 21 | 23.8% | 156 | 196 |
-20.4% |
| Daimler AG | 16,310 | 24,502 | -33.4% | 77,438 | 108,669 |
-28.7% |
| Mercedes-Benz | 15,138 | 21,798 | -30.6% | 69,965 | 99,758 |
-29.9% |
| Maybach. | 3 | 9 | -66.7% | 22 | 57 |
-61.4% |
| Smart. | 1,169 | 2,695 | -56.6% | 7,451 | 8,854 |
-15.8% |
| Subaru of America | 17,505 | 18,436 | -5.0% | 74,686 | 76,088 |
-1.8% |
| Total Cars | 10,663 | 10,813 | -1.4% | 41,965 | 48,753 |
-13.9% |
| Total Light Trucks | 6,842 | 7,623 | -10.2% | 32,721 | 27,335 |
19.7% |
| Kia Motors America | 26,060 | 31,047 | -16.1% | 120,559 | 129,327 |
-6.8% |
| Total Cars | 15,987 | 22,260 | -28.2% | 61,973 | 76,366 |
-18.8% |
| Total Light Trucks | 10,073 | 8,787 | 14.6% | 58,586 | 52,961 |
10.6% |
| Isuzu Motors America | 0 | 510 | -100.0% | 165 | 2,974 |
-94.5% |
| American Suzuki Motor | 2,585 | 10,364 | -75.1% | 20,259 | 46,459 |
-56.4% |
| Total Cars | 165 | 3,442 | -95.2% | 3,425 | 10,528 |
-67.5% |
| Total Light Trucks | 2,420 | 6,922 | -65.0% | 16,834 | 35,931 |
-53.1% |
| Jaguar Land Rover N.A. | 3,391 | 4,760 | -28.8% | 15,311 | 21,313 |
-28.2% |
| Jaguar | 1,168 | 1,757 | -33.5% | 5,198 | 7,021 |
-26.0% |
| Land Rover | 2,223 | 3,003 | -26.0% | 10,113 | 14,292 |
-29.2% |
| Porsche Cars N.A. | 1,979 | 2,796 | -29.2% | 8,757 | 12,436 |
-29.6% |
| Total Cars | 1,116 | 1,604 | -30.4% | 4,693 | 7,094 |
-33.8% |
| Total Light Trucks | 863 | 1,192 | -27.6% | 4,064 | 5,342 |
-23.9% |
| Ferrari of N.A. | 85 | 143 | -40.6% | 486 | 708 |
-31.4% |
| Maserati of N.A. | 128 | 286 | -55.2% | 483 | 1,140 |
-57.6% |
|
|
||||||
|
|
||||||
| PASSENGER CARS | 488,045 | 795,328 | -38.6% | 2,023,635 | 3,184,821 |
-36.5% |
| LIGHT TRUCKS | 437,779 | 601,705 | -27.2% | 1,925,356 | 3,038,081 |
-36.6% |
| TOTAL LIGHT SALES | 925,824 | 1,397,033 | -33.7% | 3,948,991 | 6,222,902 |
-36.5% |
|
|
||||||
| Imp. Brand Car Total | 325,902 | 539,967 | -39.6% | 1,389,732 | 2,057,308 |
-32.4% |
| Imp. Brand Light Truck | 175,194 | 236,305 | -25.9% | 792,568 | 1,159,949 |
-31.7% |
| Imp. Brand Light Veh. | 501,096 | 776,272 | -35.4% | 2,182,300 | 3,217,257 |
-32.2% |
|
|
||||||
| Imp. Sourced Car Total | 170,928 | 272,386 | -37.2% | 728,834 | 1,067,083 |
-31.7% |
| Imp. Sourced Truck Total | 82,030 | 115,736 | -29.1% | 403,791 | 558,293 |
-27.7% |
|
|
||||||
| Transplant Vehicles | 250,263 | 396,242 | -36.8% | 1,059,579 | 1,618,776 |
-34.5% |
| GM & Ford Heavy Truck | 1,328 | 4,201 | -68.4% | 6,986 | 15,503 |
-54.9% |


In response to the decline of the Asian brands one should keep in mind that a year ago with $4.00 gasoline the Honda Civic was the best selling vehicle. As for the Ford & Chevrolet trucks being # l & 2 in sales customers are being lulled back to them by cheaper gasoline. Now that gas is climbing back to near $ 3.00 per gal. will they maintain their lead ????
Fair points. We will wait and see and report on it. I think that anyone who maintains that Americans will readily embrace smaller vehicles is kidding himself.