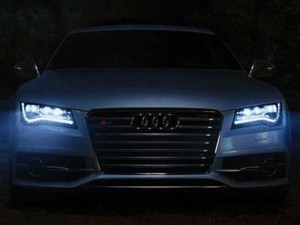
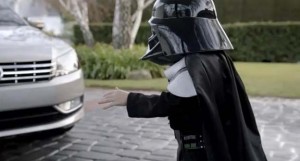
This past weekend’s games settled who gets to play on February 5 in Super Bowl XLVI but also served as a preview of the carvertising that we’ll see when the New England Patriots and NY Giants square off on the gridiron next month.
Few businesses spend more money on those :30 second spots than carmakers like Chrysler, GM Audi and – for the first time this year, Toyota, which hopes to use the Super Bowl to help kick off its comeback after several years of fumbles.
Chrysler and Volkswagen certainly scored touchdowns last year, but if the latest numbers are any indication, automakers aren’t exactly winning the game with their latest spots. Based on the Ace Scores during the prior week play-off games, the Super Bowl could turn into the Stupor Bowl© for car ads.
Ace Score is the measure of ad creative effectiveness based on viewer reaction to national TV ads. Respondents are randomly selected and representative of the U.S. TV viewing audience. The results are presented on a scale of 0-950, which represents scoring on creative attributes such as relevance, persuasion, watchability, information, attention, etc.
Automotive ads represented 27% of all of the play-off ads over the last two weekends. Notably, however, there were no auto ads within the top scoring brands. (See lists below.) Ford had 23 separate ads; Chevy and Toyota, 14 each; Nissan, 11; Volkswagen and Honda, 10 each — a total of 82 commercials. Maybe that explains the haze over the automotive ad bench?
Top Scoring Brands During the Playoffs:
| Row Labels | Average Ace Score | Count of Brand Ads |
|
644 |
1 |
|
| Apple iPhones |
640 |
6 |
| Applebee’s |
635 |
4 |
| Microsoft Windows |
631 |
7 |
| Verizon |
628 |
2 |
| Olive Garden |
619 |
1 |
| Wendy’s |
618 |
3 |
| GE Corporate Branding |
614 |
1 |
| M&M’s |
609 |
1 |
| Domino’s Pizza |
608 |
10 |
| Chili’s Grill & Bar |
608 |
6 |
| Sprint |
602 |
19 |
| Gatorade |
601 |
4 |
| Subway |
599 |
24 |
| Mentos |
597 |
5 |
| Taco Bell |
592 |
6 |
| Southwest |
591 |
14 |
| Papa John’s |
590 |
5 |
| Pizza Hut |
586 |
6 |
It’s obvious the number of commercials from a brand has little to do with how it scores or resonates with consumers. Quantity does not equal quality. Even the biggest ad schedule from Verizon is 79 points below the top scoring commercial which only ran once. The numbers in parenthesis are the difference from the top scoring Google commercial for the auto advertisers. The average deviation was a minus 104.5 points from the top but less when compared to the lowest ranked, but not by much.
Heaviest Advertisers During the Play-offs:
| Row Labels |
Average Ace Score |
Count of Brand Ads |
| Verizon Wireless |
575 |
29 |
| Subway |
599 |
24 |
| Ford (-113) |
531 |
23 |
| Sprint |
602 |
19 |
| Miller Lite |
475 |
16 |
| McDonald’s |
565 |
14 |
| Southwest |
591 |
14 |
| Chevrolet (-119) |
525 |
14 |
| AT&T Wireless |
575 |
14 |
| Toyota (-107) |
537 |
14 |
| Bud Light |
492 |
13 |
| Nissan (-81) |
563 |
11 |
| Pepsi |
567 |
11 |
| Budweiser |
479 |
10 |
| Domino’s Pizza |
608 |
10 |
| Volkswagen (-105) |
539 |
10 |
| Honda (-102) |
542 |
10 |
Let’s see what happened this past weekend; it’ll take a few days to get the data. The value of a commercial likely increased significantly thanks to the Giants’ win because of the huge television market in New York City, and the Patriots have a significant following, as well. On the other hand, will the rest of America car about a fight between two East Coast teams based barely 250 miles apart?
Stay tuned.


