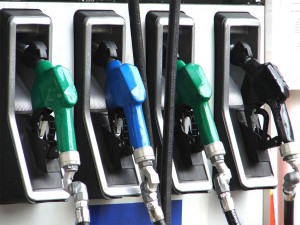
It’s easy to feel miserable when it comes time to fill the tank, fuel prices again on a fast rise across much of the country. And automotive insurance costs have been going up quickly, as well.
But how much you pay can vary widely depending upon where you live. A gallon of regular unleaded that will cost you $3.16 in South Carolina this week goes for a dollar more in Illinois, according to the latest tracking information.
Combine gas and insurance and drivers in some states can expect to pay as much as $2,000 more than their motoring cohorts in other parts of the country, according to the new Automotive Misery Index.
Measured another way, those personal transportation costs alone can range from less than 5% of the average motorist’s income all the way up to more than 11%, according to research by CarInsurance.com.
Gas and insurance costs hurt the least in New Hampshire, according to the Index, averaging $2,932 a year, or 4.4% of the typical household income. Alaska, Connecticut, Colorado and Washington round out the top five, with their Misery Index at or below 5%.
At the other end of the scale is Mississippi, with a Misery Index of 11.6%. Motorists in that state not only face some of the highest insurance and gas costs – at $4,277 annually – but have lower incomes to help cover the cost.
Insurance costs alone range from Maine’s average $889 a year to $2,589 in Louisiana. The national average, found CarInsurance.com, was $1,479.
The web site looked even more closely at insurance costs and found that they vary widely down to the zipcode level. In one part of the Bayou State motorists will need shell out just $1,874. Elsewhere, however, that nearly doubles to $3,530.
A variety of factors can influence gas and insurance costs. Gulf and East Coast states tend to be closer to ports and refineries and normally benefit from cheaper fuel. The generally higher costs in the Midwest have spiked, in recent months, due to pipeline and refinery problems.
As for insurance, rates can be influenced by whether a state is more urban or rural, and by how many miles motorists tend to drive. In Wyoming, 44th on the Misery Index, drivers tend to clock more than 20,000 miles a year compared to the national average of 14,133.
Missippi, which topped the Misery Index, is a rural state but “People drive a lot,” said CarInsurance Editor Des Toups. “It also has the highest percentage of uninsured drivers, which makes car insurance that much more expensive.”
Here’s a look at the states with the highest and the lowest Misery Index:
The 10 states where gas and insurance costs hurt the most are:
| Rank | State | Gas & Insurance | Income | Misery Index |
| 51 | Mississippi | $4,277 | $36,821 | 11.6% |
| 50 | Oklahoma | $4,816 | $45,018 | 10.7% |
| 49 | Louisiana | $4,504 | $42,813 | 10.5% |
| 48 | West Virginia | $4,292 | $41,999 | 10.2% |
| 47 | Montana | $4,005 | $41,286 | 9.7% |
| 46 | Georgia | $4,268 | $44,082 | 9.7% |
| 45 | Michigan | $4,274 | $46,597 | 9.2% |
| 44 | Wyoming | $4,828 | $52,848 | 9.1% |
| 43 | Kentucky | $3,860 | $42,302 | 9.1% |
| 42 | Arkansas | $3,411 | $37,856 | 9.0% |
The 10 states where gas and insurance costs hurt the least are:
| Rank | State | Gas & Insurance | Income | Misery Index |
| 1 | New Hampshire | $2,932 | $65,948 | 4.4% |
| 2 | Alaska | $2,765 | $60,409 | 4.6% |
| 3 | Connecticut | $3,266 | $66,187 | 4.9% |
| 4 | Colorado | $2,955 | $58,647 | 5.0% |
| 5 | Washington | $2,976 | $58,821 | 5.1% |
| 6 | Massachusetts | $3,087 | $60,843 | 5.1% |
| 7 | New Jersey | $3,301 | $64,693 | 5.1% |
| 8 | Maryland | $3,347 | $64,635 | 5.2% |

