Buying a used vehicle can be an exercise in frustration, especially since the number of factors that go into such a purchase can be astronomical. Fuel economy, color, price, type of vehicle, etc. can create real problems.
However, one factor often leads the pack: safety. Cars, trucks and SUVs produced in the last decade are the safety vehicles ever produced, but there are some that seem to be more dangerous than others, and iSeeCars.com has put together a list of the most dangerous vehicles from 2013-2017.
Using the U.S. Department of Transportation’s Fatality Analysis Reporting System, each is at least two times as likely as the average auto to be involved in a deadly accident, the site noted.
A quick look at the list reveals no real surprises as all of the vehicles on the list are either small cars or sport coupes. Larger and heavier vehicles tend to better protect occupants in a crash better than will smaller and lighter ones.
(Rear-seat occupants at higher risk of death, injury in crash warns IIHS. Click Here for the story.)
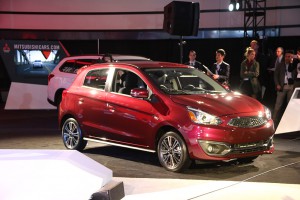
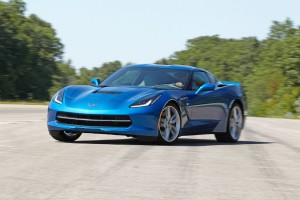
Topping the list is the Mitsubishi Mirage, with a fatal accident rate of 10.2 cars per billion vehicle miles — the national average is 2.6 deaths per billion vehicle miles. Second is the Chevrolet Corvette with 9.8 cars per billion vehicle miles.
“Subcompact cars have a fatal accident rate of 4.5 cars per billion vehicle miles, which is almost double the overall average, (while) sports cars are the vehicle segment with the highest fatal accident rate of 4.6 cars per billion vehicle miles,” said iSeeCars CEO Phong Ly. “Passenger cars also have a higher fatal accident rate than trucks and SUVs, which are larger vehicles.”
Here are the top 14 most dangerous vehicles:
- Mitsubishi Mirage: 10.2 cars per billion vehicle miles.
- Chevrolet Corvette: 9.8 cars per billion vehicle miles.
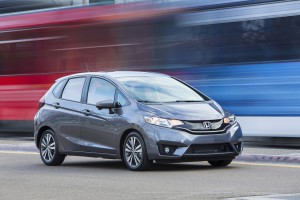
- Honda Fit: 7.7 cars per billion vehicle miles.
- Kia Forte: 7.4 cars per billion vehicle miles.
- Chevrolet Spark: 7.2 cars per billion vehicle miles.
- Subaru BRZ: 6.9 cars per billion vehicle miles.
- Nissan 370Z: 6.2 cars per billion vehicle miles.
- Nissan Versa: 6.1 cars per billion vehicle miles.
- Kia Rio: 5.9 cars per billion vehicle miles.
- Dodge Challenger: 5.8 cars per billion vehicle miles.
- Chevrolet Camaro: 5.5 cars per billion vehicle miles.
- Kia Soul: 5.3 cars per billion vehicle miles.
- Hyundai Veloster Turbo: 5.2 cars per billion vehicle miles.
- Nissan Versa Note: 5.2 cars per billion vehicle miles.
(Have increased speed limits contributed to rising highway death toll? Click Here for the full story.)
Not surprisingly, fatal accident rates in SUVs are 34% lower than the overall average due to their size and weight advantage over smaller compact and subcompact models on the roads. Those models tend to have the highest fatal accident rates within the segment.
At the top of that list is the Kia Sportage with a fatal accident rate of 3.8 cars per billion vehicle miles, the site notes. The pickup from the 2013-2017 model years having the highest fatality rate is the Nissan Frontier at 3.9 cars per billion miles recorded.
In most cases, the vehicles that recorded the highest fatality rates are those that scored poorly in crash tests, especially those conducted by the IIHS, and offered little in the way of advanced safety features.
(To see if motorists are willing to sell their privacy, Click Here.)
“By selecting a vehicle with favorable crash test ratings across the board as well as with active safety features, you are more likely to be protected in the case of a serious accident,” Ly said. “However, these safety features aren’t a substitute for safe driving, which is your best defense from a vehicle fatality.”


