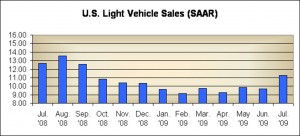
Helped by the hefty infusion of government money into the marketplace, and a corresponding increase in showroom traffic, as well as additional manufacture rebates, the seasonally adjusted annual selling rate (SAAR) topped ten million for the first time this year.
“Sales may still be down 12% from a year ago, but they’re up 16% from June,” said American International Automobile Dealer Association President Cody Lusk. “Cash for Clunkers is a stimulus plan that works. Dealers now look to Congress to keep the momentum going by allocating additional funds to the program.”
According to numbers from AutoData Corporation, offshore brands sold 562,988 vehicles in July, up from 469,713 in June, but down from 650,887 in July 2008. Asian brands accounted for 48.7% percent of the market, up from 45.8% in June 2009. Europeans had a 7.8% market share, down from 8.8%. Domestic brands finished the month with 43.6% of the market.
The House of Representatives has passed an emergency bill to approve $2 billion to continue the CARS program, but serious questions are being raised about the need for additional funding.
|
Total U.S. Light Vehicle Retail Sales (SAAR, Million Units) Observations from July 2008 – July 2009 |
|||||||||||||||||
|
July 08 |
Aug 08 |
Sep 08 |
Oct 08 |
Nov 08 |
Dec 08 |
Jan 09 |
Feb 09 |
Mar 09 |
Apr 09 |
May 09 |
Jun 09 |
July 09 |
|||||
| Annual Rate |
12.7 |
13.6 |
12.6 |
10.8 |
10.4 |
10.4 |
9.6 |
9.2 |
9.7 |
9.23 |
9.9 |
9.7 |
11.2 |
||||
| Car |
6.9 |
6.8 |
6.3 |
5.7 |
5.2 |
5.3 |
4.7 |
4.7 |
5.0 |
4.77 |
4.9 |
5.0 |
6.2 |
||||
| Truck |
5.7 |
6.8 |
6.3 |
5.1 |
5.3 |
5.1 |
4.9 |
4.5 |
4.7 |
4.46 |
5.0 |
4.7 |
5.0 |
||||
| Domestic Car |
4.4 |
4.4 |
4.3 |
3.7 |
3.4 |
3.6 |
2.9 |
3.0 |
3.2 |
3.08 |
3.2 |
3.3 |
4.1 |
||||
| Domestic Truck |
4.7 |
5.7 |
5.2 |
4.1 |
4.3 |
4.1 |
3.9 |
3.4 |
3.6 |
3.63 |
4.1 |
3.8 |
4.1 |
||||
| Total Domestic Saar |
9.0 |
10.1 |
9.4 |
7.8 |
7.6 |
7.6 |
6.8 |
6.4 |
6.8 |
6.72 |
7.2 |
7.1 |
8.2 |
||||
| Import Car |
2.5 |
2.3 |
2.0 |
2.0 |
1.8 |
1.7 |
1.8 |
1.7 |
1.8 |
1.69 |
1.7 |
1.8 |
2.1 |
||||
| Import Truck |
1.0 |
1.1 |
1.1 |
1.0 |
1.0 |
1.0 |
1.1 |
1.1 |
1.1 |
0.82 |
0.9 |
0.9 |
1.0 |
||||
| Total Import |
3.6 |
3.5 |
3.2 |
3.0 |
2.8 |
2.7 |
2.8 |
2.8 |
2.9 |
2.51 |
2.6 |
2.6 |
3.1 |
||||
| AutoData Corporation *This analysis reflects the restated BEA seasonal factors as of August 3, 2009 | |||||||||||||||||
It is by no means clear that the Senate will approve additional taxpayer funding of the CARS program, aka Clunkers, which has predominately helped brands from offshore makers that have restricted access to their home markets.
“Even if current “cash-for-clunkers” funds in fact have been exhausted, the Senate should not rush to provide additional funding,” said Lena Pons, Policy Analyst, Public Citizen’s Congress Watch Division. “It is not surprising that a large number of people would claim $4,500 handouts to buy new cars. This is not an indication that the program is meeting its actual goals-reducing harmful emissions and stimulating the economy. Before appropriating any additional funds, the Senate should take the time to study whether the program is working.”
Public Citizen’s complaints, mirrored by other observers, raise several questions:
- The average fuel economy improvement between traded-in and purchased vehicles;
- What fraction of the transactions resulted in the purchase of new light trucks, maintaining the current fleet mix?
- How many people purchased a vehicle because of the incentive, compared to the number who would have purchased a new car without it; and
- Whether the old cars were actually being driven much at all, or their owners merely received a windfall for trading them in even though the trade did not reduce harmful emissions.
None of these questions are new, of course, they have been around since last January when the original Clunkers bills were proposed. It all depends on how you view the program – one that is supposed to help fuel economy and emissions, or one that is a handout to struggling auto dealers and makers.

