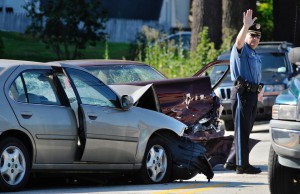
Traffic fatalities in the U.S. fell for the first time in two years, according to the National Highway Traffic Safety Administration.
After two years of increased traffic deaths on U.S. roadways, the National Highway Traffic Safety Administration reported fatalities fell 1.8% in 2017.
The previous increases came despite newer vehicles being the safest ever built so the causes of the spike – which came after nearly two decades of declines – were difficult to pinpoint for federal safety officials to nail down.
In 2017, deaths related to pedestrians, drunk driving, speeding, bicyclists and motorcyclists all fell. The overall rate of fatalities fell to 1.16 deaths per 100 million miles traveled. This happened ever as Americans set another record for miles traveled behind the wheel, jumping 1.2% last year.
“The 1.8% decrease from 2016 to 2017 compares to the 6.5% increase from 2015 to 2016 and the 8.4% increase from 2014 and 2015,” the report said.
(Better headlights could save pedestrians’ lives. Click Here for the story.)
While the full 2017 Fatality Analysis Reporting System (FARS) data set will be available today, other notable changes include:
- Pedestrian fatalities declined about 2%, the first decline since 2013;
- For the second year in a row, more fatalities occurred in urban areas than rural areas;
- Combination trucks involved in fatal crashes increased 5.8%;
- Vehicle miles traveled (VMT) increased by 1.2% from 2016 to 2017; and
- The fatality rate per 100 million VMT decreased by 2.5%, from 1.19 in 2016 to 1.16 in 2017.
“Dangerous actions such as speeding, distracted driving, and driving under the influence are still putting many Americans, their families and those they share the road with at risk,” said NHTSA Deputy Administrator Heidi R. King in a statement.
(To see why advanced driver assistance systems could raise, not cut insurance costs, Click Here.)
“Additionally, we must address the emerging trend of drug-impaired driving to ensure we are reducing traffic fatalities and keeping our roadways safe for the traveling public.”

