There is no way to sugar coat the bitter bill.
Automotive sales remain depressed at levels unheard of in more than four decades.
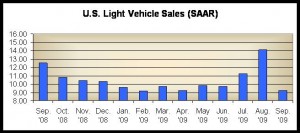
The seasonally adjusted annual selling rate for September, at 9.2 million vehicles, came in at the lowest rate since February of this year. With the economy stalled, consumer confidence shaken, unemployment rising and no end in sight to the ongoing Great Recession, 2009 will be written off as a disaster for most automakers.
Chart follows.
|
Total U.S. Light Vehicle Retail Sales September 2009 (SAAR, Millions) |
|||||||||||||
| 9/08 | 10/08 | 11/08 | 12/08 | 1/09 | 2/09 | 3/09 | 4/09 | 5/09 | 6/09 | 7/09 | 8/09 | 9/09 | |
| Annual Rate | 12.6 | 10.8 | 10.4 | 10.3 | 9.6 | 9.2 | 9.7 | 9.2 | 9.9 | 9.7 | 11.2 | 14.1 | 9.2 |
| Total Car | 6.3 | 5.7 | 5.2 | 5.3 | 4.7 | 4.7 | 5.0 | 4.8 | 4.9 | 5.0 | 6.2 | 8.1 | 5.0 |
| Total Truck | 6.3 | 5.1 | 5.3 | 5.1 | 4.9 | 4.6 | 4.7 | 4.6 | 5.0 | 4.7 | 5.0 | 6.1 | 4.2 |
| Domestic Car | 4.3 | 3.7 | 3.3 | 3.6 | 2.9 | 3.0 | 3.2 | 3.1 | 3.2 | 3.3 | 4.13 | 5.3 | 3.3 |
| Domestic Truck | 5.2 | 4.1 | 4.3 | 4.1 | 3.9 | 3.4 | 3.6 | 3.6 | 4.1 | 3.8 | 4.1 | 4.7 | 3.4 |
| Total Domestic | 9.4 | 7.8 | 7.6 | 7.6 | 6.8 | 6.4 | 6.8 | 6.7 | 7.2 | 7.1 | 8.2 | 10.0 | 6.6 |
| Import Car | 2.1 | 2.1 | 1.8 | 1.7 | 1.8 | 1.7 | 1.8 | 1.7 | 1.7 | 1.8 | 2.1 | 2.8 | 1.8 |
| Import Truck | 1.1 | 1.0 | 1.0 | 1.0 | 1.1 | 1.1 | 1.1 | 0.8 | 0.9 | 0.9 | 1.0 | 1.3 | 0.8 |
| Total Import | 3.2 | 3.0 | 2.8 | 2.7 | 2.8 | 2.8 | 2.9 | 2.5 | 2.6 | 2.6 | 3.1 | 4.1 | 2.6 |
| Courtesy AutoData *This analysis reflects the restated BEA seasonal factors as of August 3, 2009. Rounding used | |||||||||||||

